
Renting vs. Owning: The Financial Trade-offs That Don't Show Up in Calculators

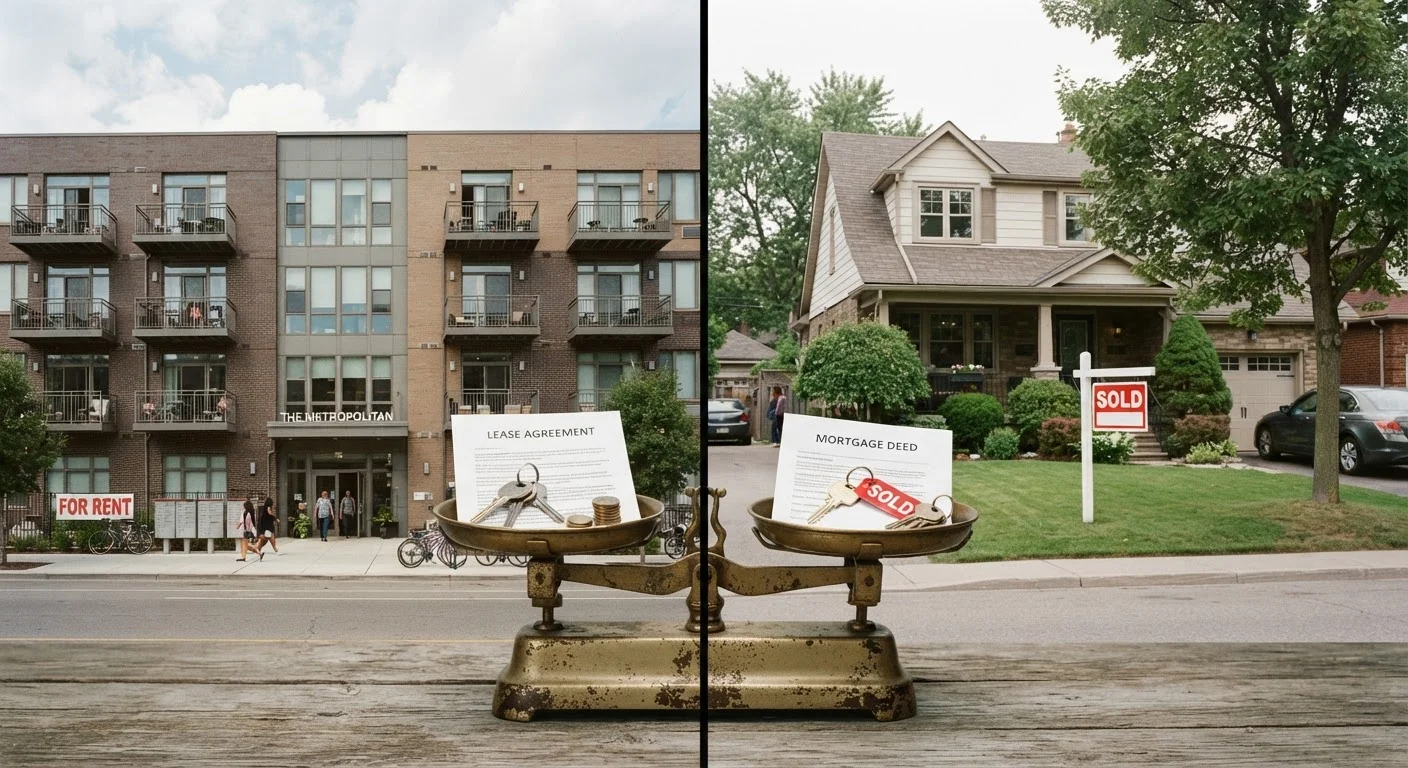
Photo: QuickSearches.net | It Doesn't Get Quicker Than This! editorial
Key Takeaways
- Calculators often omit maintenance costs, which typically run 1-2% of a home's value annually.
- Renters face hidden costs too - application fees, utility deposits, and annual rent increases compound over time.
- Opportunity cost of a down payment is a real financial factor that most tools underweight.
- Property taxes, HOA fees, and insurance add hundreds to thousands per year beyond the mortgage payment.
- Neither renting nor owning is universally superior - local market conditions and personal stability matter enormously.
What Calculators Get Right - and What They Miss
Rent-vs-buy calculators are a useful starting point. They typically compare monthly rent against a mortgage payment, factor in projected appreciation, and spit out a break-even timeline. But they are working with a simplified model of reality. The inputs most calculators use - purchase price, interest rate, rent, and appreciation rate - represent only a portion of the true cost of each path.
What gets left out is often what tips the scales. On the ownership side, calculators frequently omit or underestimate ongoing maintenance, property tax increases, homeowners association (HOA) fees, private mortgage insurance (PMI) if your down payment is under 20%, and the transaction costs of eventually selling. On the renting side, they often ignore predictable annual rent increases, renters insurance, and the compounding effect of moving costs over time. For a more grounded look at the renting side of the ledger, see hidden costs renters commonly overlook.
The True Cost of Owning a Home
The mortgage payment is just the beginning. Homeowners should budget for several expense categories that don't appear in the loan agreement:
- Maintenance and repairs: A commonly cited rule of thumb is to budget 1-2% of the home's purchase price per year for upkeep. On a $300,000 home, that's $3,000-$6,000 annually - money that simply disappears rather than builds equity.
- Property taxes: These vary dramatically by state and county, ranging from under 0.5% to over 2% of assessed value annually. They also tend to rise over time.
- Homeowners insurance: Premiums have risen significantly in many markets due to climate-related risk. Coastal and wildfire-prone areas can see costs far exceeding national averages.
- HOA fees: In condos and many planned communities, HOA fees can run $200-$600 or more per month - and special assessments can appear without warning.
- Closing costs: Buying typically costs 2-5% of the purchase price upfront. Selling adds another 5-6% in agent commissions and fees. These transaction costs must be recovered before ownership becomes financially advantageous.
| Cost Factor | Renting | Owning | |
|---|---|---|---|
| Monthly housing payment | Fixed by lease term | Mortgage + taxes + insurance + HOA | |
| Maintenance costs | Landlord's responsibility | 1-2% of home value per year | |
| Equity building | None | Partial (interest dominates early years) | |
| Upfront capital required | Security deposit (1-2 months rent) | Down payment + 2-5% closing costs | |
| Exposure to market swings | Rent inflation risk | Home value appreciation or loss | |
| Flexibility to relocate | High - lease-limited only | Low - selling takes months and costs | |
| Tax considerations | No deductions on rent | Mortgage interest & property tax deductions (subject to limits) |
The opportunity cost of the down payment deserves separate attention. A 20% down payment on a $350,000 home is $70,000. That capital is now illiquid, tied to a single asset. If invested in a diversified portfolio, that same amount could generate meaningful returns over time - a trade-off that calculators rarely model transparently.
The True Cost of Renting Long-Term
Renting is not simply "throwing money away," but it does carry real financial costs that tend to be underappreciated. The most significant is the absence of equity accumulation. Every monthly payment covers housing but builds no asset. Over 10 or 20 years, this gap becomes substantial, particularly in markets where home values have appreciated.
Rent inflation is a structural risk for long-term renters. In many US metros, rents have risen faster than general inflation over the past decade. A renter paying $1,500 per month today could be paying $1,900 or more within five years if local conditions tighten - with no fixed-rate equivalent to a mortgage.
Renters also face reduced control over their housing stability. Lease non-renewals, property sales, and landlord decisions can force relocation, which carries moving costs, potential gaps in housing, and disruption. The core rights and responsibilities renters need to understand can help mitigate some of this uncertainty, but instability remains an inherent feature of renting in most US markets.
Use the Price-to-Rent Ratio Before Deciding
How Local Markets Change the Math
One of the biggest weaknesses in generic rent-vs-buy calculators is that they apply national averages to local decisions. The price-to-rent ratio - a home's purchase price divided by annual rent for a comparable unit - varies enormously across US markets. A ratio below 15 generally favors buying; above 20 generally favors renting; above 25 makes buying very difficult to justify on pure financial grounds.
In high-cost coastal metros, price-to-rent ratios have historically exceeded 30. In many Midwest and Sun Belt cities, ratios in the 12-18 range can make ownership compelling. Running the local numbers - not national averages - is essential before drawing any conclusions. For a more detailed comparison of how these trade-offs play out across different life circumstances, this honest assessment of renting vs. buying is worth reviewing alongside this analysis.
Time horizon is equally important. Most analyses suggest that a homeowner needs to stay in a property for at least five to seven years just to recover transaction costs. Buying a home with a two- or three-year horizon is rarely advantageous and can be actively harmful if the market softens.
This article is for general informational and educational purposes only and does not constitute financial, legal, or investment advice. Readers should consult a qualified financial professional before making real estate decisions specific to their circumstances.
The content on this site is provided for informational purposes only and should not be considered a substitute for professional advice. While we strive to provide accurate and up-to-date information, we make no guarantees regarding its completeness or accuracy. Always consult a qualified professional for advice specific to your circumstances before making any decisions